Measures of dispersion
- Daniel Pichardo
- Data science
- February 7, 2025
Table of Contents
Introduction
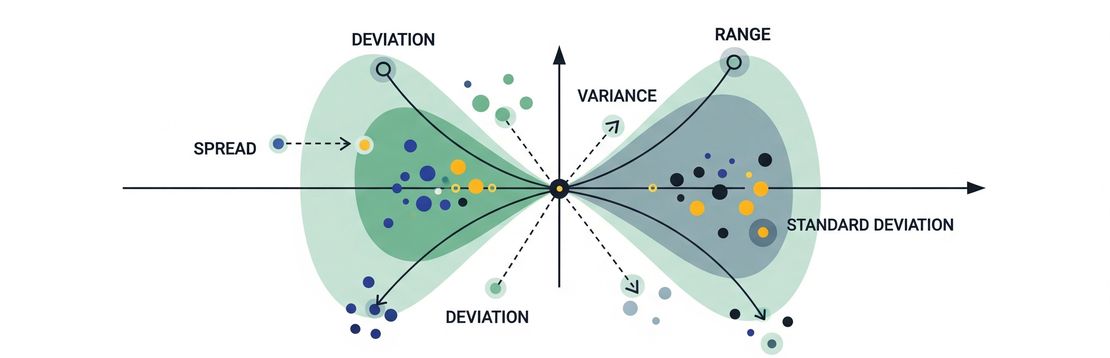
Measures of dispersion quantify how much data values vary or spread out. Understanding dispersion helps you grasp the reliability, consistency, and variability of data.
1. Range
📌 Definition:
The difference between the maximum and minimum values in a dataset.
\[ \text{Range} = \text{Max} - \text{Min} \]✅ Best Practices:
- Use for quick insights into data spread.
- Best for small datasets or when outliers are not present.
🧠 Interpretation:
- A large range suggests high variability.
- A small range indicates data values are close together.
⚠️ Limitations:
- Highly sensitive to outliers.
- Doesn’t reflect the distribution between the extremes.
Example:
Dataset: [10, 12, 15, 22, 100]
Range = 100 - 10 = 90
2. Variance
📌 Definition:
The average of squared deviations from the mean.
\[ \text{Variance} = \frac{1}{n} \sum_{i=1}^{n}(x_i - \bar{x})^2 \]✅ Best Practices:
- Use when comparing variability across multiple datasets.
- Ideal for understanding total dispersion mathematically.
🧠 Interpretation:
- Higher variance = more spread out data.
- Lower variance = values are clustered around the mean.
⚠️ Limitations:
- Units are squared, making it less interpretable in original units.
- Sensitive to outliers.
3. Standard Deviation (SD)
📌 Definition:
The square root of variance, making it directly comparable to the original data units.
\[ \sigma = \sqrt{\text{Variance}} \]✅ Best Practices:
- Preferred over variance for interpretation.
- Use when you need insights into average deviation from the mean.
🧠 Interpretation:
- Small SD: data is tightly packed.
- Large SD: values are more dispersed.
- In normal distributions: ~68% of values lie within ±1 SD of the mean.
⚠️ Limitations:
- Assumes symmetry in distribution.
- Sensitive to outliers.
4. Interquartile Range (IQR)
📌 Definition:
The range between the first (Q1) and third quartiles (Q3).
\[ \text{IQR} = Q3 - Q1 \]✅ Best Practices:
- Use for skewed data or datasets with outliers.
- Excellent for comparing central spread.
🧠 Interpretation:
- Small IQR = concentrated data.
- Large IQR = variable middle 50%.
⚠️ Limitations:
- Ignores data in the tails.
5. Mean Absolute Deviation (MAD)
📌 Definition:
The average of the absolute differences from the mean.
\[ \text{MAD} = \frac{1}{n} \sum_{i=1}^{n} |x_i - \bar{x}| \]✅ Best Practices:
- Useful for a robust, intuitive view of variability.
- Less affected by outliers than variance or SD.
🧠 Interpretation:
- Smaller MAD → more consistency.
- Larger MAD → more variation.
🔁 Comparison Table
| Measure | Sensitive to Outliers | Easy to Interpret | Uses All Data Points | Robust for Skewed Data |
|---|---|---|---|---|
| Range | ✅ Yes | ✅ Yes | ❌ No | ❌ No |
| Variance | ✅ Yes | ❌ No | ✅ Yes | ❌ No |
| Standard Dev. | ✅ Yes | ✅ Yes | ✅ Yes | ❌ No |
| IQR | ❌ No | ✅ Yes | ❌ No | ✅ Yes |
| MAD | ⚠️ Moderately | ✅ Yes | ✅ Yes | ✅ Yes |
🧪 Real-World Use Cases
| Industry | Use Case |
|---|---|
| Finance | Standard deviation of asset returns (volatility) |
| Healthcare | Variability in patient recovery times |
| Manufacturing | IQR and Range in quality control |
| Education | MAD to evaluate student performance spread |
| Marketing | Analyzing customer spending variability |
🧠 Summary
- Use SD or Variance for complete datasets.
- Use IQR or MAD for skewed or outlier-prone data.
- Always visualize for better interpretation (boxplots, histograms).