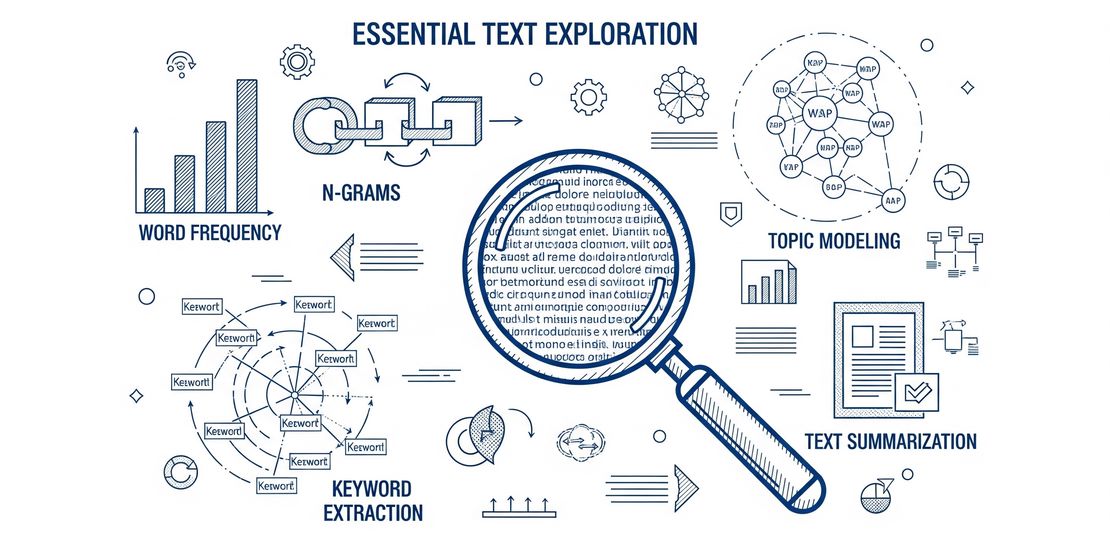
An In-Depth Guide to Essential Text Exploration Techniques
- Daniel Pichardo
- Artificial intelligence , Nlp
- August 6, 2025
Table of Contents
Introduction
Text exploration is the indispensable first step in Natural Language Processing (NLP) and data science, where raw, unstructured text is transformed into meaningful, actionable insights. By applying these techniques, we can uncover hidden patterns, themes, and linguistic properties that are crucial for building more advanced models and making data-driven decisions. This guide details 15 of the most important text exploration techniques, complete with their applications, units of analysis, metrics, visualization strategies, and key scientific references. 💡
1. Frequency Analysis
Description:
Frequency analysis is the process of counting the occurrences of words or terms in a text. It is a fundamental technique that provides a quantitative measure of the most common topics or concepts within a corpus.
Unit of analysis:
Words, phrases.
Applications:
- Identify important terms/themes
- Understanding the focus of a document
- Preparing data for more advanced analyses like topic modeling.
- Create stopword lists
- Track topic salience
Metrics:
| Metrics | Description |
|---|---|
| Raw Frequency: | The absolute count of a term in a document |
| Term Frequency (TF): | The raw frequency of a term divided by the total number of terms in the document. This normalizes the frequency for document length. |
| Term Frequency-Inverse Document Frequency (TF-IDF): | A more advanced metric that weighs the term frequency by its inverse document frequency (the logarithm of the total number of documents divided by the number of documents containing the term). This gives higher weight to terms that are frequent in a specific document but rare across the entire corpus. |
Techniques:
| Technique | Description |
|---|---|
| Tokenization | Breaking down the text into individual words or tokens. |
| Stopword Removal | Removing common words (e.g., “the,” “a,” “is”) that do not carry significant meaning. |
| Stemming/Lemmatization | Reducing words to their root form (e.g., “running” to “run”). |
Visualization Strategy:
| Technique | Description |
|---|---|
| Word Clouds | A visual representation of word frequency where the size of each word is proportional to its frequency. |
| Bar Charts | A simple and effective way to display the frequency of the top N words. |
Step-by-step explanation:
- Pre-process the text: Clean the text by removing punctuation, converting to lowercase, and performing tokenization, stopword removal, and stemming/lemmatization.
- Count word frequencies: Create a dictionary or a frequency distribution of all the words in the text.
- Analyze the results: Identify the most frequent words to understand the main topics of the text.
Interpretation of the results:
High-frequency words often indicate the main subjects of the text. However, context is crucial, as some high-frequency words may be common in the given domain and not necessarily the most important.
Key papers or scientific article:
Luhn, H. P. (1957). A statistical approach to mechanized encoding and searching of literary information. IBM Journal of Research and Development, 1(4), 309-317.
Tools:
NLTK (Python), spaCy (Python), TextBlob (Python), AntConc.
2. N-gram Analysis
Description
N-gram analysis involves identifying and counting contiguous sequences of n items (words, letters, etc.) in a text. Bigrams (n=2) and trigrams (n=3) are the most common.
Unit of analysis
Phrases.
Applications
Identifying common phrases and collocations, feature extraction for machine learning models, and language modeling.
Metrics
| Metric | Description |
|---|---|
| Frequency of the n-gram | The number of times an n-gram appears in the text. |
Techniques
| Technique | Description |
|---|---|
| Tokenization and counting | Similar to frequency analysis, it involves tokenization and counting, but for sequences of words. |
Visualization Strategy
| Strategy | Description |
|---|---|
| Bar Charts | To show the frequency of the most common n-grams. |
| Network Graphs | To visualize the relationships between words in n-grams. |
Step-by-step explanation
Pre-process the text: Similar to frequency analysis.
Generate n-grams: Create a list of all n-grams in the text.
Count n-gram frequencies: Count the occurrences of each n-gram.
Analyze the results: Identify the most frequent n-grams to find common phrases and expressions.
Interpretation of the results
Frequent n-grams can reveal common expressions, named entities, or concepts that are not apparent from single-word frequency analysis.
Key papers or scientific article
Jurafsky, D., & Martin, J. H. (2009). Speech and language processing: An introduction to natural language processing, computational linguistics, and speech recognition. Pearson Prentice Hall.
Tools
NLTK (Python), spaCy (Python), scikit-learn (Python).
3. Concordance (KWIC)
Description
A concordance, or Key Word in Context (KWIC), is a list of all occurrences of a particular word or phrase in a corpus, with a certain amount of context shown on either side.
Unit of analysis
Words, phrases.
Applications
- Understanding the different meanings and uses of a word
- Identifying patterns of usage
- Exploring the context in which a word appears.
- Analyze word usage and meaning
- Investigate stylistic or semantic patterns
Metrics
Not applicable for this technique.
Techniques
Not applicable for this technique.
Visualization Strategy
| Strategy | Description |
|---|---|
| List of text snippets | The output is typically a list of text snippets, with the keyword highlighted and centered. |
Step-by-step explanation
Select a keyword: Choose the word or phrase you want to analyze.
Search the corpus: Find all instances of the keyword in the text.
Generate the concordance: For each instance, extract a snippet of the surrounding text (the context).
Analyze the concordance: Examine the different contexts to understand the usage of the keyword.
Interpretation of the results
By examining the words that appear before and after the keyword, you can gain insights into its semantic and syntactic properties.
Key papers or scientific article
Leech, G. (1992). Corpora and theories of linguistic performance. In J. Svartvik (Ed.), Directions in corpus linguistics (pp. 105-122). Mouton de Gruyter.
Tools
AntConc, Sketch Engine, NLTK (Python).
4. Collocation Analysis
Description
Collocation analysis identifies words that frequently co-occur in a text. These are words that have a strong tendency to appear together, such as “strong coffee” or “pay attention.”
Unit of analysis
Phrases.
Applications
- Identifying idiomatic expressions
- Understanding the semantic relationships between words
- Improving the accuracy of machine translation and information retrieval systems.
- Phrase extraction
- Language modeling
- Terminology mining
Metrics
| Metric | Description |
|---|---|
| Pointwise Mutual Information (PMI) | Measures the association between two words. A high PMI indicates a strong collocation. |
| Chi-square | A statistical test to determine if the co-occurrence of two words is statistically significant. |
| T-score | Another statistical test for the significance of a collocation. |
Techniques
Not applicable for this technique.
Visualization Strategy
| Strategy | Description |
|---|---|
| Network Graphs | To show the relationships between collocating words. |
| Tables | To list the most significant collocations and their statistical scores. |
Step-by-step explanation
Identify candidate pairs: Generate all possible pairs of words within a certain window of context.
Calculate association scores: For each pair, calculate a statistical measure like PMI or Chi-square.
Filter and rank: Filter out insignificant pairs and rank the remaining ones by their association score.
Interpretation of the results
A high association score between two words suggests that they form a meaningful collocation. This can reveal important semantic relationships in the text.
Key papers or scientific article
Manning, C. D., & Schütze, H. (1999). Foundations of statistical natural language processing. MIT press.
Tools
NLTK (Python), spaCy (Python), Sketch Engine.
5. Lexical Richness/Diversity
Description
Lexical richness, or diversity, measures the variety of vocabulary used in a text. A text with high lexical richness uses a wide range of different words, while a text with low lexical richness is more repetitive.
Unit of analysis
Words.
Applications
- Assessing the complexity of a text
- Analyzing writing style
- Comparing the vocabulary of different authors or genres
- Text complexity estimation
- Authorship attribution
- Language learning analysis
Metrics
| Metric | Description |
|---|---|
| Type-Token Ratio (TTR) | The number of unique words (types) divided by the total number of words (tokens). A higher TTR indicates greater lexical diversity. |
| Measure of Textual Lexical Diversity (MTLD) | A more robust measure of lexical diversity that is less sensitive to text length. |
| vocd | Another measure of lexical diversity that is robust to text length. |
Techniques
Not applicable for this technique.
Visualization Strategy
| Strategy | Description |
|---|---|
| Line Charts | To show how lexical diversity changes over the course of a text. |
| Bar Charts | To compare the lexical diversity of different texts. |
Step-by-step explanation
Count types and tokens: Count the number of unique words (types) and the total number of words (tokens) in the text.
Calculate a lexical diversity metric: Use a metric like TTR, MTLD, or vocd to quantify the lexical richness.
Interpret the result: A value closer to 1 in TTR indicates higher lexical diversity. For MTLD and vocd, higher values also indicate greater diversity.
Interpretation of the results
A high lexical diversity score can indicate a more complex and sophisticated writing style, while a low score might suggest a simpler or more repetitive style.
Key papers or scientific article
McCarthy, P. M., & Jarvis, S. (2010). MTLD, vocd-D, and HD-D: A validation study of sophisticated approaches to lexical diversity assessment. Behavior research methods, 42(2), 381-392.
Tools
lexical-diversity (Python package), koRpus (R package).
6. Keyword Analysis
Description
Keyword analysis aims to identify the most important and representative words in a text. These are the words that best summarize the content of the document.
Unit of analysis
Words.
Applications
Document summarization, information retrieval, and search engine optimization (SEO).
Metrics
| Metric | Description |
|---|---|
| TF-IDF | A powerful metric for identifying keywords. |
| Rake (Rapid Automatic Keyword Extraction) | An algorithm that extracts keywords by analyzing the co-occurrence of words in a text. |
Techniques
| Technique | Description |
|---|---|
| Statistical methods | Using metrics like TF-IDF to score and rank words. |
| Graph-based methods | Representing the text as a graph and using centrality measures to identify important words. |
Visualization Strategy
| Strategy | Description |
|---|---|
| Word Clouds | To visually represent the most important keywords. |
| Tables | To list the top keywords and their scores. |
Step-by-step explanation
Pre-process the text: Clean and prepare the text as in frequency analysis.
Calculate keyword scores: Use an algorithm like TF-IDF or Rake to assign a score to each word.
Extract keywords: Select the words with the highest scores as the keywords.
Interpretation of the results
The extracted keywords should provide a concise summary of the main topics and concepts discussed in the text.
Key papers or scientific article
Rose, S., Engel, D., Cramer, N., & Cowley, W. (2010). Automatic keyword extraction from individual documents. In Text Mining (pp. 1-20). Springer, Boston, MA.
Tools
scikit-learn (Python), rake-nltk (Python), spaCy (Python).
7. Dispersion Analysis
Description
Dispersion analysis examines how words are distributed throughout a text. It helps to understand if a word is used consistently throughout the document or concentrated in specific sections.
Unit of analysis
Words.
Applications
- Analyzing writing style
- Identifying changes in topic or focus
- Understanding the structure of a document
- Topic distribution tracking
- Authorship analysis
- Narrative structure
Metrics
Not applicable for this technique.
Techniques
Not applicable for this technique.
Visualization Strategy
| Strategy | Description |
|---|---|
| Dispersion Plot | A plot that shows the location of a word every time it appears in the text. This allows for a visual inspection of the word’s distribution. |
Step-by-step explanation
Select a word: Choose the word you want to analyze.
Find all occurrences: Locate every instance of the word in the text.
Create a dispersion plot: Plot the position of each occurrence on a horizontal axis representing the length of the text.
Interpretation of the results
A dispersion plot can reveal patterns in word usage. For example, a word that appears only at the beginning of a text might be part of an introduction, while a word that appears throughout might be a central theme.
Key papers or scientific article
Gries, S. T. (2008). Dispersions and adjusted frequencies in corpora. International Journal of Corpus Linguistics, 13(4), 403-437.
Tools
NLTK (Python), Yellowbrick (Python).
8. Readability Analysis
Description
Readability analysis assesses the ease with which a reader can understand a text. It uses various formulas to calculate a readability score based on factors like sentence length and word complexity.
Unit of analysis
Sentences, paragraphs.
Applications
- Improving the clarity and accessibility of written content,
- tailoring content to a specific audience
- Evaluating the complexity of legal or technical documents.
- Education and curriculum design
- Legal/medical writing
- Accessibility assessment
Metrics
| Metric | Description |
|---|---|
| Flesch Reading Ease | A score from 0 to 100, where a higher score indicates easier readability. |
| Flesch-Kincaid Grade Level | A score that corresponds to a U.S. grade level, indicating the number of years of education needed to understand the text. |
| Gunning Fog Index | A grade-level score that estimates the years of formal education needed to understand the text on the first reading. |
| Dale-Chall Readability Formula | A formula that uses a list of common words to assess readability. |
Techniques
Not applicable for this technique.
Visualization Strategy
| Strategy | Description |
|---|---|
| Gauges or Dials | To show the readability score in a visually intuitive way. |
| Bar Charts | To compare the readability of different texts. |
Step-by-step explanation
Calculate text statistics: Count the number of words, sentences, and syllables in the text.
Apply a readability formula: Use a formula like the Flesch Reading Ease or Flesch-Kincaid Grade Level to calculate a readability score.
Interpret the score: A Flesch Reading Ease score between 60 and 70 is considered easily understandable by most adults. A Flesch-Kincaid Grade Level of 8 means the text is suitable for an eighth-grade student.
Interpretation of the results
A low readability score indicates that the text is difficult to read and may need to be simplified. A high score suggests that the text is easy to understand.
Key papers or scientific article
Flesch, R. (1948). A new readability yardstick. Journal of applied psychology, 32(3), 221.
Tools
textstat (Python), readability (Python), koRpus (R package).
9. Topic Modeling
Description
Topic modeling is an unsupervised machine learning technique that automatically discovers abstract “topics” that occur in a collection of documents. It is a powerful tool for exploring the thematic structure of a large corpus.
Unit of analysis
Documents, paragraphs.
Applications
- Discovering hidden themes in a large dataset
- Organizing documents by topic
- Understanding the content of a corpus at a high level
- Document classification
- Thematic exploration
- Content recommendation
Metrics
Not applicable for this technique.
Techniques
| Technique | Description |
|---|---|
| Latent Dirichlet Allocation (LDA) | A probabilistic model that assumes each document is a mixture of topics and each topic is a mixture of words. |
| Non-negative Matrix Factorization (NMF) | A linear algebra-based model that decomposes a document-term matrix into a document-topic matrix and a topic-term matrix. |
Visualization Strategy
| Strategy | Description |
|---|---|
| Word Clouds | To visualize the top words for each topic. |
| Interactive visualizations (e.g., pyLDAvis) | To explore the topics and their relationships in an interactive way. |
Step-by-step explanation
Pre-process the text: Create a document-term matrix from the corpus.
Train a topic model: Use an algorithm like LDA or NMF to discover the topics in the corpus.
Analyze the topics: Examine the top words for each topic to understand its meaning.
Assign topics to documents: Determine the topic composition of each document.
Interpretation of the results
The output of a topic model is a set of topics, each represented by a list of words. By examining these words, you can infer the meaning of each topic. The model also provides the topic distribution for each document, showing which topics are most prominent in that document.
Key papers or scientific article
Blei, D. M., Ng, A. Y., & Jordan, M. I. (2003). Latent dirichlet allocation. Journal of machine Learning research, 3(Jan), 993-1022.
Tools
scikit-learn (Python), Gensim (Python), MALLET (Java).
10. Named Entity Recognition (NER)
Description
Named Entity Recognition (NER) is a subtask of information extraction that seeks to locate and classify named entities in text into pre-defined categories such as the names of persons, organizations, locations, expressions of times, quantities, monetary values, percentages, etc.
Unit of analysis
Words, phrases.
Applications
- Information extraction
- Question answering
- Content categorization
- Information extraction
- Event recognition
- Knowledge graphs
Metrics
Not applicable for this technique.
Techniques
| Technique | Description |
|---|---|
| Rule-based | Using handcrafted rules and dictionaries to identify named entities. |
| Machine learning-based | Using supervised learning models like Conditional Random Fields (CRFs) or deep learning models like LSTMs and Transformers to learn to recognize named entities from labeled data. |
Visualization Strategy
| Strategy | Description |
|---|---|
| Highlighted text | Highlighting the named entities in the text with different colors for each category. |
Step-by-step explanation
Train or load a NER model: Use a pre-trained model or train a custom model on your own data.
Apply the model to the text: The model will identify and classify the named entities in the text.
Extract the entities: Extract the identified entities and their categories for further analysis.
Interpretation of the results
The output of a NER system is a list of named entities and their corresponding categories. This can be used to quickly extract structured information from unstructured text.
Key papers or scientific article
Nadeau, D., & Sekine, S. (2007). A survey of named entity recognition and classification. Lingvisticae Investigationes, 30(1), 3-26.
Tools
spaCy (Python), NLTK (Python), Stanford NER (Java), Flair (Python).
11. Sentiment Analysis
Description
Sentiment analysis, or opinion mining, is the process of computationally identifying and categorizing opinions expressed in a piece of text, especially in order to determine whether the writer’s attitude towards a particular topic, product, etc., is positive, negative, or neutral.
Unit of analysis
Sentences, paragraphs, documents.
Applications
- Brand monitoring
- Customer feedback analysis
- Market research
- Brand monitoring
- Political analysis
- Review mining
Metrics
| Metric | Description |
|---|---|
| Polarity | A score that indicates the sentiment of the text, typically ranging from -1 (negative) to 1 (positive). |
| Subjectivity | A score that indicates whether the text expresses an opinion or a factual statement. |
Techniques
| Technique | Description |
|---|---|
| Lexicon-based | Using a dictionary of words with pre-assigned sentiment scores. |
| Machine learning-based | Training a classifier on a labeled dataset of positive, negative, and neutral texts. |
Visualization Strategy
| Strategy | Description |
|---|---|
| Pie Charts or Bar Charts | To show the overall distribution of sentiment (positive, negative, neutral). |
| Time Series Plots | To track sentiment over time. |
Step-by-step explanation
Choose an approach: Decide whether to use a lexicon-based or machine learning-based approach.
Analyze the text: Apply the chosen method to the text to determine its sentiment.
Aggregate the results: If analyzing a large corpus, aggregate the sentiment scores to get an overall picture of the sentiment.
Interpretation of the results
A positive sentiment score indicates a positive opinion, a negative score indicates a negative opinion, and a score around zero indicates a neutral or mixed opinion.
Key papers or scientific article
Pang, B., & Lee, L. (2008). Opinion mining and sentiment analysis. Foundations and Trends® in Information Retrieval, 2(1–2), 1-135.
Tools
TextBlob (Python), VADER (Python), spaCy (with extensions), MonkeyLearn.
12. Semantic Analysis
Description
Semantic analysis is the process of understanding the meaning of a text. It goes beyond the literal meaning of words to consider the context, intent, and relationships between concepts.
Unit of analysis
Words, phrases, sentences, paragraphs.
Applications
- Chatbots
- Virtual assistants
- Advanced search engines
- Word sense disambiguation
- Semantic search
- Text similarity
Metrics
Not applicable for this technique.
Techniques
| Technique | Description |
|---|---|
| Word Sense Disambiguation (WSD) | Identifying the correct meaning of a word in a given context. |
| Semantic Role Labeling (SRL) | Identifying the roles that words play in a sentence (e.g., who did what to whom). |
| Word embeddings | Converting words into numerical vectors that capture their meaning (e.g., Word2Vec, GloVe, fastText). |
| Contextualized embeddings | Creating word vectors that consider the context (e.g., BERT, ELMo). |
Visualization Strategy
| Strategy | Description |
|---|---|
| Semantic Networks | To visualize the relationships between concepts in a text. |
| t-SNE or UMAP plots | To visualize the semantic similarity of words or documents in a low-dimensional space. |
Step-by-step explanation
Represent words as vectors: Use a technique like Word2Vec or BERT to convert words into numerical vectors that capture their meaning.
Analyze semantic relationships: Use these vectors to perform tasks like WSD or SRL.
Interpretation of the results
The goal of semantic analysis is to create a representation of the text that captures its meaning. This can be used to power more intelligent and human-like NLP applications.
Key papers or scientific article
Mikolov, T., Chen, K., Corrado, G., & Dean, J. (2013). Efficient estimation of word representations in vector space. arXiv preprint arXiv:1301.3781.
Tools
Gensim (Python), spaCy (Python), Hugging Face Transformers (Python).
13. Part-of-Speech (POS) Tagging
Description
Part-of-Speech (POS) tagging is the process of marking up a word in a text as corresponding to a particular part of speech (e.g., noun, verb, adjective), based on both its definition and its context.
Unit of analysis
Words.
Applications
- Syntactic parsing
- Information extraction
- Text-to-speech synthesis
- Syntax analysis
- Text generation
- Grammar correction
Metrics
Not applicable for this technique.
Techniques
| Technique | Description |
|---|---|
| Rule-based | Using handcrafted rules to assign POS tags. |
| Stochastic | Using probabilistic models like Hidden Markov Models (HMMs) or Maximum Entropy Markov Models (MEMMs) to predict the most likely sequence of POS tags. |
| Deep learning-based | Using neural networks to learn to assign POS tags. |
Visualization Strategy
| Strategy | Description |
|---|---|
| Annotated text | The output is typically the text with each word annotated with its POS tag. |
Step-by-step explanation
Train or load a POS tagger: Use a pre-trained tagger or train a custom one.
Apply the tagger to the text: The tagger will assign a POS tag to each word in the text.
Interpretation of the results
The POS tags provide grammatical information about the words in the text, which can be used as a feature for other NLP tasks.
Key papers or scientific article
Brill, E. (1992). A simple rule-based part of speech tagger. In Proceedings of the third conference on Applied natural language processing (pp. 152-155).
Tools
NLTK (Python), spaCy (Python), Stanford POS Tagger (Java), Flair (Python).
14. Syntactic Parsing
Description
Syntactic parsing, or parsing, is the process of analyzing a string of symbols, either in natural language, computer languages or data structures, conforming to the rules of a formal grammar. The term parsing comes from Latin pars (ōrātiōnis), meaning part (of speech).
Unit of analysis
Sentences.
Applications
- Machine translation
- Grammar checking
- Question answering
- Machine translation
- Text summarization
Metrics
Not applicable for this technique.
Techniques
| Technique | Description |
|---|---|
| Constituency Parsing | Breaking a sentence down into its constituent parts, such as noun phrases and verb phrases. |
| Dependency Parsing | Analyzing the grammatical relationships between words in a sentence, creating a tree of dependencies. |
Visualization Strategy
| Strategy | Description |
|---|---|
| Parse Trees | A tree diagram that shows the syntactic structure of a sentence. |
Step-by-step explanation
Train or load a parser: Use a pre-trained parser or train a custom one.
Apply the parser to a sentence: The parser will generate a parse tree that represents the syntactic structure of the sentence.
Interpretation of the results
The parse tree reveals the grammatical structure of the sentence, which can be used to understand its meaning and to perform more advanced NLP tasks.
Key papers or scientific article
Manning, C. D. (2003). Parsing: The last twenty-five years. In Proceedings of the 41st Annual Meeting on Association for Computational Linguistics (pp. 1-8).
Tools
spaCy (Python), NLTK (Python), Stanford Parser (Java), AllenNLP (Python).
15. Text Summarization
Description
Text summarization is the task of creating a short, accurate, and fluent summary of a longer text document.
Unit of analysis
Sentences, paragraphs, documents.
Applications
- News aggregation
- Document summarization
- Generating headlines.
Metrics
| Metric | Description |
|---|---|
| ROUGE (Recall-Oriented Understudy for Gisting Evaluation) | A set of metrics for evaluating automatic summarization and machine translation software in natural language processing. |
| BLEU (Bilingual Evaluation Understudy) | An algorithm for evaluating the quality of text which has been machine-translated from one natural language to another. |
Techniques
| Technique | Description |
|---|---|
| Extractive Summarization | Selecting the most important sentences from the original text to form the summary. |
| Abstractive Summarization | Generating new sentences that capture the essence of the original text. |
Visualization Strategy
| Strategy | Description |
|---|---|
| Summarized text | The output is the summarized text itself. |
Step-by-step explanation
Choose a summarization approach: Decide whether to use an extractive or abstractive method.
Apply the summarization model: The model will process the original text and generate a summary.
Interpretation of the results
The summary should be a concise and coherent representation of the main information in the original text.
Key papers or scientific article
Nenkova, A., & McKeown, K. (2012). A survey of text summarization techniques. In Mining text data (pp. 43-76). Springer, Boston, MA.
Tools
Gensim (Python), Hugging Face Transformers (Python), Sumy (Python).
Summary Table
| Technique | Purpose | Unit of analysis | Visualization Strategies | Approaches & Models | Metrics |
|---|---|---|---|---|---|
| Frequency Analysis | Identify common topics | Words, phrases | Word Clouds, Bar Charts | - | Raw Frequency, TF, TF-IDF |
| N-gram Analysis | Identify common phrases | Phrases | Bar Charts, Network Graphs | - | Frequency |
| Concordance (KWIC) | Understand word usage in context | Words, phrases | List of text snippets | - | - |
| Collocation Analysis | Identify words that co-occur | Phrases | Network Graphs, Tables | - | PMI, Chi-square, T-score |
| Lexical Richness | Measure vocabulary variety | Words | Line Charts, Bar Charts | - | TTR, MTLD, vocd |
| Keyword Analysis | Identify important words | Words | Word Clouds, Tables | Rake | TF-IDF |
| Dispersion Analysis | Analyze word distribution | Words | Dispersion Plot | - | - |
| Readability Analysis | Assess text complexity | Sentences, paragraphs | Gauges, Bar Charts | - | Flesch, Gunning Fog |
| Topic Modeling | Discover hidden themes | Documents, paragraphs | Word Clouds, Interactive plots | LDA, NMF | - |
| NER | Identify named entities | Words, phrases | Highlighted text | CRF, BiLSTM-CRF, BERT | - |
| Sentiment Analysis | Determine opinion polarity | Sentences, documents | Pie Charts, Time Series | Lexicon-based, ML-based | Polarity, Subjectivity |
| Semantic Analysis | Understand text meaning | Words, sentences | Semantic Networks, t-SNE | Word2Vec, BERT | - |
| POS Tagging | Identify grammatical parts of speech | Words | Annotated text | HMM, MEMM, BiLSTM | - |
| Syntactic Parsing | Analyze grammatical structure | Sentences | Parse Trees | Constituency, Dependency | - |
| Text Summarization | Create concise summaries | Documents | - | Extractive, Abstractive | ROUGE, BLEU |
Conclusions
The text exploration techniques discussed in this article provide a powerful toolkit for anyone looking to extract value from text data. From simple frequency counts to sophisticated deep learning models, these techniques offer a wide range of capabilities for understanding, analyzing, and summarizing text.
It is important to note that these techniques are not mutually exclusive. In fact, they are often used in combination to achieve a more comprehensive understanding of the text. For example, frequency analysis and POS tagging can be used as pre-processing steps for topic modeling or sentiment analysis.
As the volume of text data continues to grow, the importance of these techniques will only increase. By mastering these tools, you can unlock the valuable insights hidden in text and gain a competitive advantage in a wide range of fields.
References
Blei, D. M., Ng, A. Y., & Jordan, M. I. (2003). Latent dirichlet allocation. Journal of machine Learning research, 3(Jan), 993-1022.
Brill, E. (1992). A simple rule-based part of speech tagger. In Proceedings of the third conference on Applied natural language processing (pp. 152-155).
Flesch, R. (1948). A new readability yardstick. Journal of applied psychology, 32(3), 221.
Gries, S. T. (2008). Dispersions and adjusted frequencies in corpora. International Journal of Corpus Linguistics, 13(4), 403-437.
Jurafsky, D., & Martin, J. H. (2009). Speech and language processing: An introduction to natural language processing, computational linguistics, and speech recognition. Pearson Prentice Hall.
Leech, G. (1992). Corpora and theories of linguistic performance. In J. Svartvik (Ed.), Directions in corpus linguistics (pp. 105-122). Mouton de Gruyter.
Luhn, H. P. (1957). A statistical approach to mechanized encoding and searching of literary information. IBM Journal of Research and Development, 1(4), 309-317.
Manning, C. D. (2003). Parsing: The last twenty-five years. In Proceedings of the 41st Annual Meeting on Association for Computational Linguistics (pp. 1-8).
Manning, C. D., & Schütze, H. (1999). Foundations of statistical natural language processing. MIT press.
McCarthy, P. M., & Jarvis, S. (2010). MTLD, vocd-D, and HD-D: A validation study of sophisticated approaches to lexical diversity assessment. Behavior research methods, 42(2), 381-392.
Mikolov, T., Chen, K., Corrado, G., & Dean, J. (2013). Efficient estimation of word representations in vector space. arXiv preprint arXiv:1301.3781.
Nadeau, D., & Sekine, S. (2007). A survey of named entity recognition and classification. Lingvisticae Investigationes, 30(1), 3-26.
Nenkova, A., & McKeown, K. (2012). A survey of text summarization techniques. In Mining text data (pp. 43-76). Springer, Boston, MA.
Pang, B., & Lee, L. (2008). Opinion mining and sentiment analysis. Foundations and Trends® in Information Retrieval, 2(1–2), 1-135.
Rose, S., Engel, D., Cramer, N., & Cowley, W. (2010). Automatic keyword extraction from individual documents. In Text Mining (pp. 1-20). Springer, Boston, MA.